Visual Mapping

Sixteen Ways to Map a Complicated Subject

Each of the sixteen techniques is paired with the question it answers best, a worked example, and an honest account of its strengths and limits.

Different visualization methods answer different questions. No single diagram can show every dimension of a complicated subject, so each technique below comes with the question it answers best.

The techniques are grouped by purpose. Some explore a subject, some organize it, some connect its people and events, some test its claims, and some explain why a pattern repeats. A research project usually needs several of them, and the same facts can appear in more than one map.

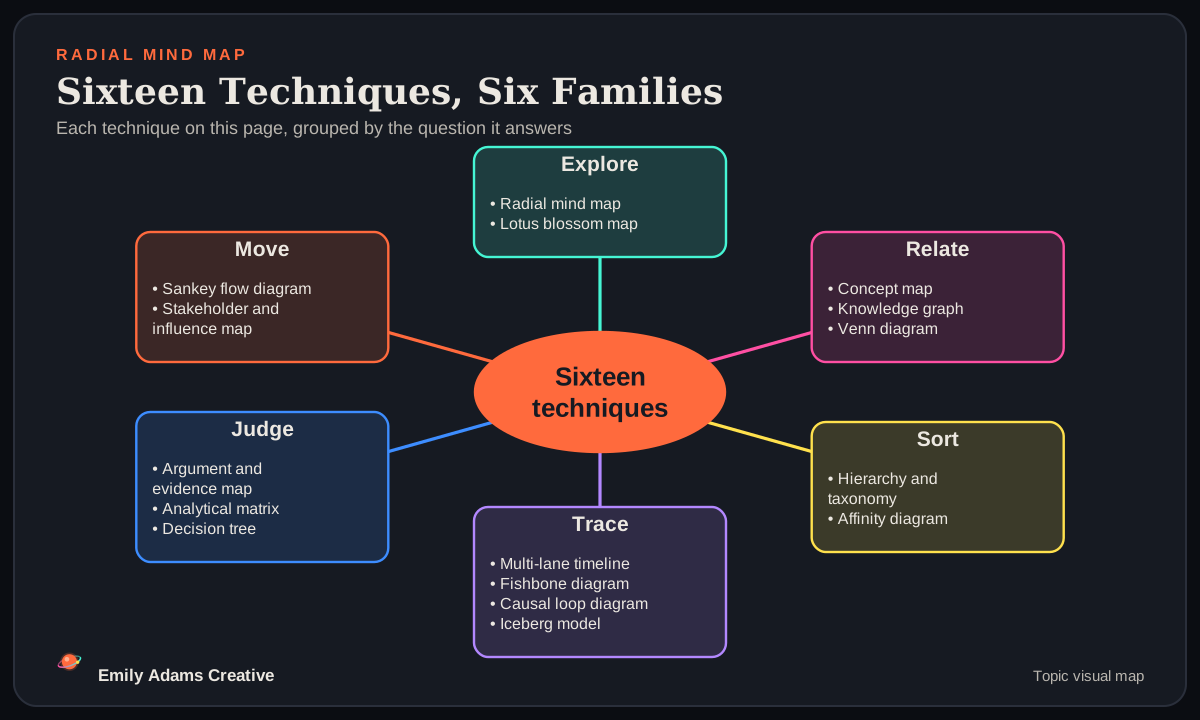
Radial mind map. The centre reads Sixteen techniques. Six branches hold the techniques: Explore holds the radial mind map and the lotus blossom map; Relate holds the concept map, the knowledge graph and the Venn diagram; Sort holds the hierarchy and taxonomy tree and the affinity diagram; Trace holds the multi-lane timeline, the fishbone diagram, the causal loop diagram and the iceberg model; Judge holds the argument and evidence map, the analytical matrix and the decision tree; Move holds the Sankey flow diagram and the stakeholder and influence map.
The sixteen Visual Mapping techniques, grouped by the question each one answers. Each technique has its own section below.

Choose a Technique by Question

Start with the question in front of you. Each row opens the technique that answers it.

No.QuestionTechnique
01What topics should be explored?Radial Mind Mapping
02How do these concepts relate?Concept Mapping
03How should information be classified?Hierarchy Trees and Taxonomy Maps
04How are people, ideas, and events connected?Knowledge Graphs
05What reinforces a recurring pattern?Causal Loop Diagrams
06What evidence supports a claim?Argument and Evidence Mapping
07What happened, and in what order?Multi-Lane Timelines
08What factors may explain an outcome?Fishbone (Ishikawa) Diagrams
09How do these cases compare?Analytical Matrices
10What deeper structures may sustain a pattern?Iceberg Models
11Which action or classification follows?Decision Trees
12How do resources or information move?Sankey and Flow Diagrams
13What characteristics overlap?Venn and Overlap Diagrams
14How can a topic be expanded systematically?Lotus Blossom Maps
15What recurring themes emerge from observations?Affinity Diagrams
16Who holds authority or influence?Stakeholder and Influence Maps

A Working Sequence

The techniques build on one another. A subject usually moves through these six stages, and each stage hands its output to the next.

Explore

Techniques: Radial mind maps, lotus blossom maps, affinity diagrams

Produces: A comprehensive first outline of the subject.

Organize

Techniques: Hierarchy and taxonomy trees

Produces: Stable categories and a navigable structure.

Connect

Techniques: Knowledge graphs, concept maps, stakeholder and influence maps

Produces: A map of documented entities and relationships.

Investigate

Techniques: Multi-lane timelines, argument and evidence maps, analytical matrices

Produces: Case analyses backed by evidence.

Explain

Techniques: Causal loop diagrams, fishbone diagrams, iceberg models

Produces: Testable explanations of recurring patterns.

Synthesize

Techniques: Decision trees, flow diagrams, Venn diagrams

Produces: Conclusions linked to their supporting material.

Five Rules for Every Map

These rules apply to all sixteen techniques, whatever the subject.

  1. Separate documented facts from claims, interpretations, hypotheses, and unknowns.
  2. Do not confuse chronology with causality. Two developments that occur together do not establish a link between them.
  3. Show uncertainty openly, using consistent labels such as verified, strongly supported, tentative, disputed, unsupported, and unknown.
  4. Keep every connection traceable from the diagram to the relationship it shows, the evidence behind it, and the original source.
  5. Do not let closeness imply connection. Nodes that sit near each other look related, so placement should never replace a documented link.

Where These Techniques Sit in the Foundations

Visual mapping belongs to the metacognition pillar of the twelve foundational pillars of critical thinking. Concept mapping, mind mapping, and knowledge graphs appear in that pillar as tools for examining how we organize what we believe.

The Sixteen Techniques

Each technique has its title and text on the left and its diagram at the top right, beside the title. Select a diagram to open it at full size.

Technique 01 · Exploration and Brainstorming

Radial Mind Mapping

Best for: What topics should be explored?

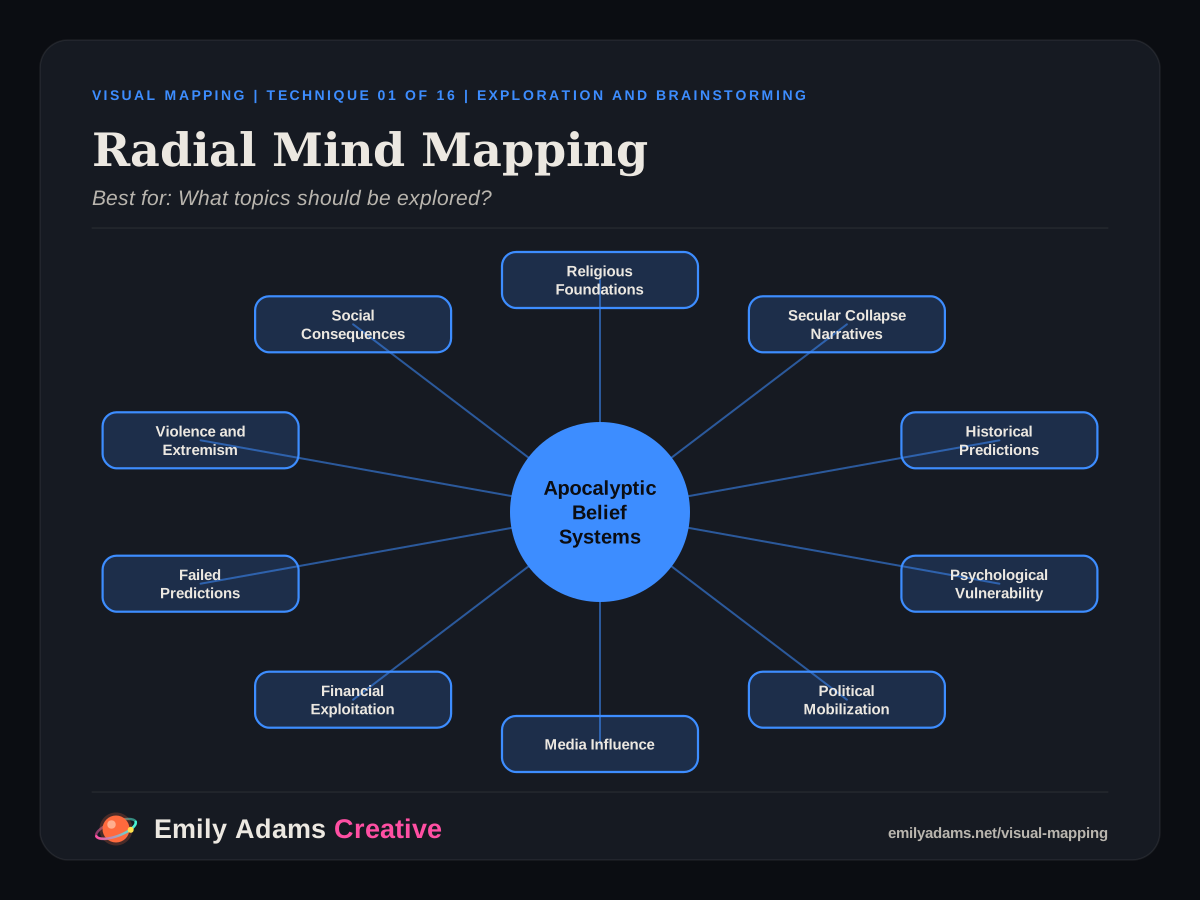
A radial mind map begins with a central subject and expands outward through branches for categories, subtopics, and supporting ideas. It is the fastest way to turn an unfamiliar subject into a list of things to research.

Practical example

Central subject: Apocalyptic Belief Systems. Branches include religious foundations, secular collapse narratives, historical predictions, psychological vulnerability, political mobilization, media influence, financial exploitation, failed predictions, violence and extremism, and social consequences.

Good uses

  • Brainstorming a complicated subject before reading begins
  • Identifying research categories a project is missing
  • Planning a book, report, or academic project
  • Breaking an overwhelming question into manageable parts

Strengths

  • Intuitive, with almost no setup
  • Encourages open exploration
  • Reveals gaps in the research plan

Limitations

  • Cross-category relationships are hard to show
  • Large maps become cluttered
  • Does not separate evidence from interpretation

Best stage: Initial topic exploration.
Technique 02 · Relationships and Conceptual Understanding

Concept Mapping

Best for: How do these concepts relate?

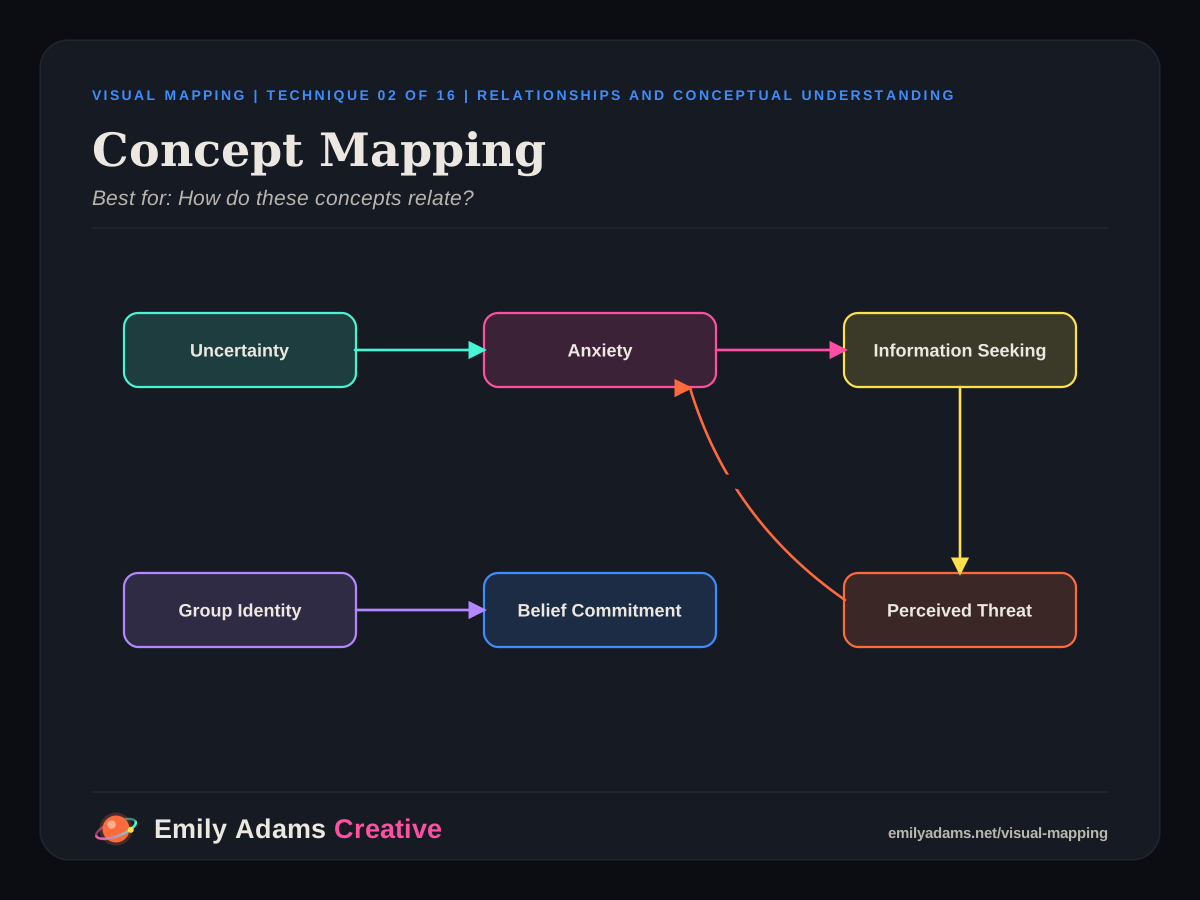
A concept map links ideas with labeled relationships. Unlike a basic mind map, concepts can connect across branches, and every connection states the kind of relationship it describes.

Practical example

Uncertainty increases anxiety. Anxiety increases information seeking. Information seeking reinforces perceived threat. Group identity strengthens belief commitment. Each link stays a hypothesis until research supports it.

Good uses

  • Explaining abstract theories
  • Mapping philosophical arguments
  • Comparing psychological or sociological mechanisms
  • Finding contradictions between concepts

Strengths

  • Analytically precise
  • Handles connections across disciplines
  • Makes assumptions visible

Limitations

  • Becomes dense as concepts multiply
  • Each link needs a careful label
  • Readers may mistake a link for proven causation

Best stage: Conceptual analysis and theory development.

Technique 03 · Classification and Organization

Hierarchy Trees and Taxonomy Maps

Best for: How should information be classified?

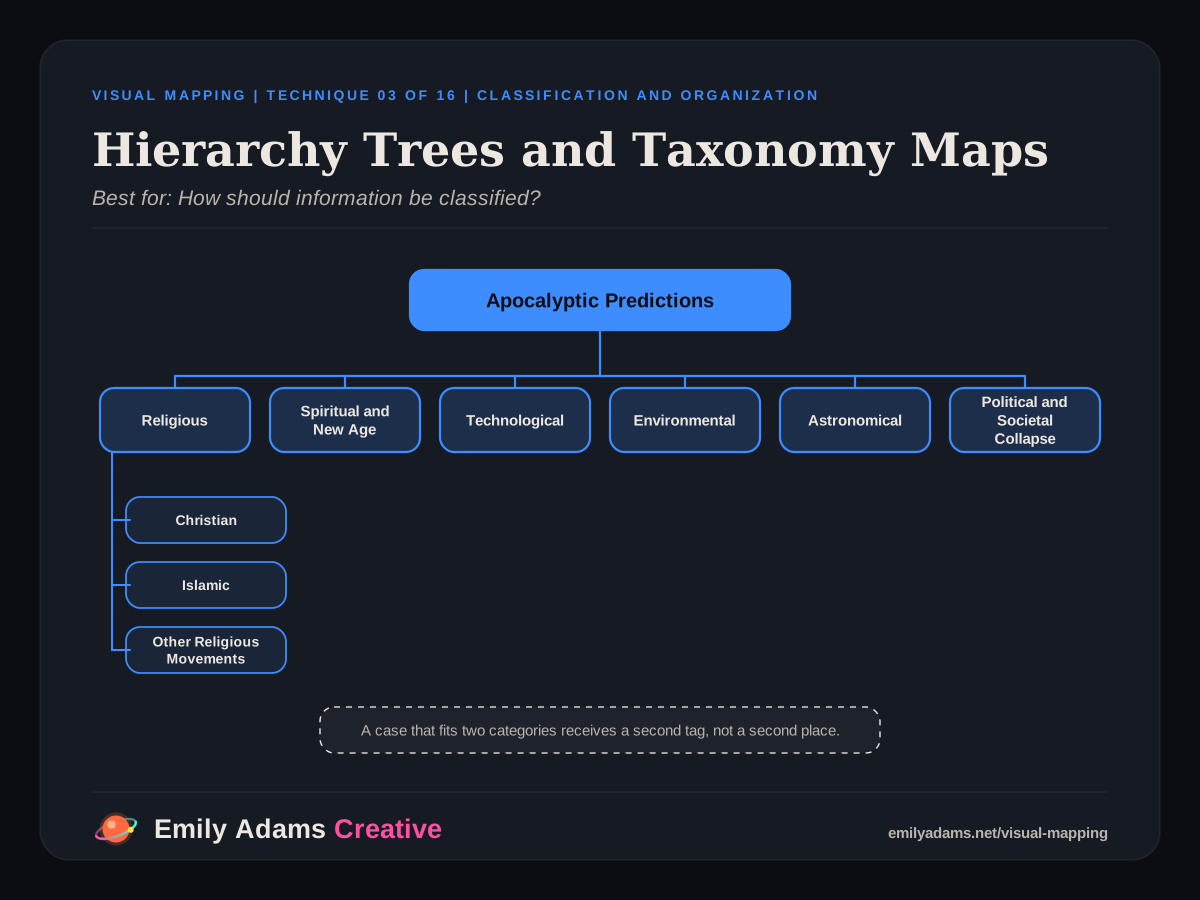
A hierarchy places a broad subject at the top and divides it into increasingly specific categories. It is the structure behind an encyclopedia, a research archive, or the navigation menu of a large site.

Practical example

Apocalyptic predictions divide into religious (Christian, Islamic, and other religious movements), spiritual and New Age, technological, environmental, astronomical, and political and societal collapse. A case that fits two categories receives a second tag rather than a second place in the tree.

Good uses

  • Building an encyclopedia or research archive
  • Organizing document libraries and terminology
  • Classifying movements and ideologies
  • Designing navigation for a large body of content

Strengths

  • Clear, predictable organization
  • Excellent for navigation
  • Scales well to large archives

Limitations

  • Assumes stable categories
  • Overlapping cases need extra tags
  • Complex subjects do not always fit neat branches

Best stage: Research organization and content architecture.

Technique 04 · Network Analysis and Connected Knowledge

Knowledge Graphs

Best for: How are people, ideas, and events connected?

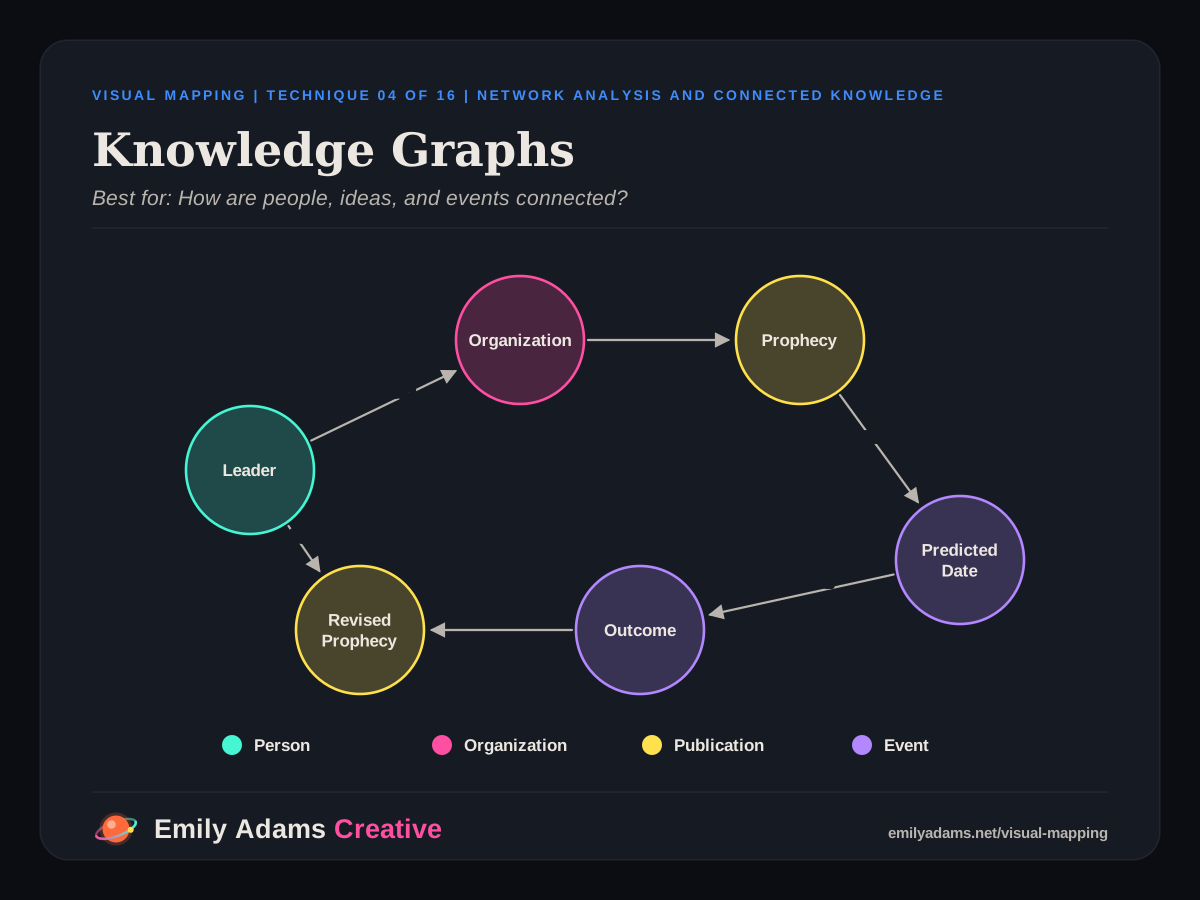
A knowledge graph represents entities as nodes and documented relationships as labeled edges. People, organizations, events, publications, and claims can sit in one network, and the network can be searched by the relationships between them.

Practical example

A leader founded an organization. The organization published a prophecy with a predicted date. The outcome and any revised prophecy are recorded as separate events, and each edge carries its own source record.

Good uses

  • Mapping ideological movements and their leaders
  • Investigating organizational networks
  • Connecting historical events to people and places
  • Exploring citations across a research collection

Strengths

  • Strong for exploring across topics
  • Can hold thousands of entities
  • Reveals important network structures

Limitations

  • Requires disciplined data modeling
  • Clutter grows with scale
  • Network closeness can mislead, so every relationship must be verified and labeled

Best stage: Building a comprehensive, interconnected research system.

Technique 05 · Systems Thinking and Feedback

Causal Loop Diagrams

Best for: What reinforces a recurring pattern?

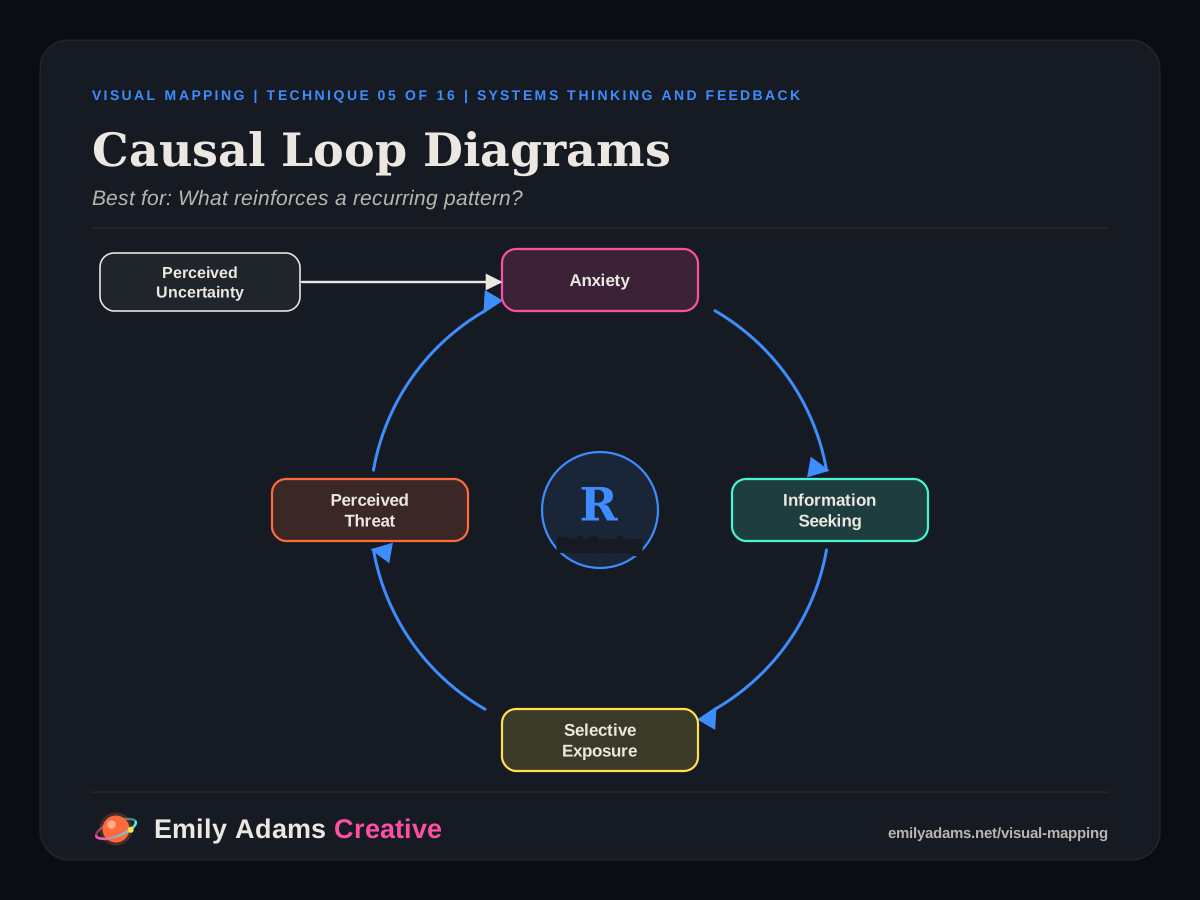
A causal loop diagram shows how variables influence one another through feedback. A reinforcing loop amplifies change, and a balancing loop pushes a system back toward a stable state.

Practical example

Perceived uncertainty increases anxiety. Anxiety increases threat-related information seeking. Selective exposure reinforces perceived threats. Stronger threat perceptions raise anxiety again. The loop describes one possible pathway that research must test.

Good uses

  • Understanding social feedback cycles
  • Analyzing radicalization pathways
  • Studying how misinformation spreads
  • Finding points where a system can be interrupted

Strengths

  • Reveals dynamic interactions
  • Highlights where to intervene
  • Goes beyond simple linear explanations

Limitations

  • Easy to oversimplify
  • Each causal link needs evidence
  • Time delays are difficult to show

Best stage: Explaining processes and recurring dynamics.

Technique 06 · Critical Thinking and Epistemology

Argument and Evidence Mapping

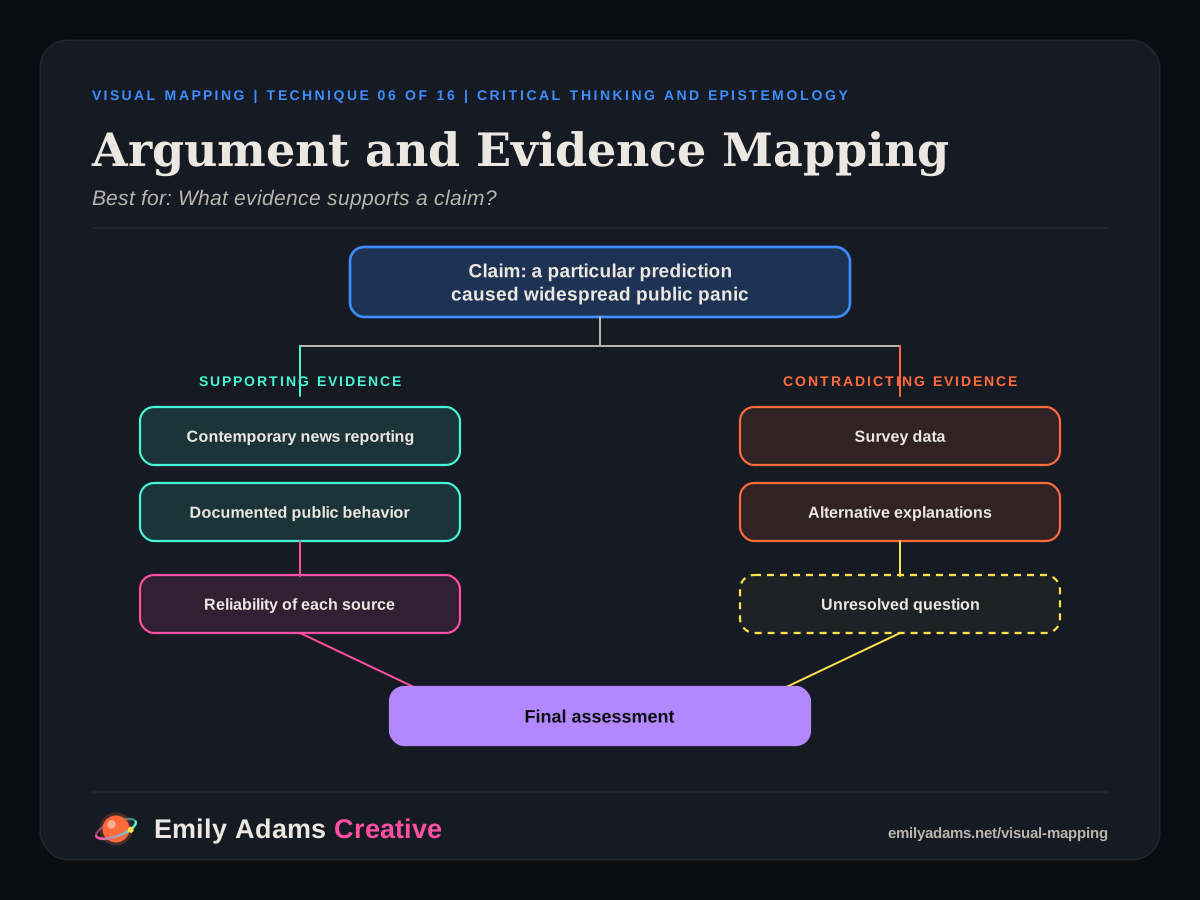
Best for: What evidence supports a claim?

An argument map separates the claim from its premises, supporting evidence, objections, rebuttals, assumptions, and open questions. Its purpose is to evaluate reasoning, not simply to display related ideas.

Practical example

Claim: a particular prediction caused widespread public panic. Branches cover contemporary news reporting, survey data, documented public behavior, alternative explanations, the reliability of each source, and a final assessment that shows which way the evidence points.

Good uses

  • Fact-checking a viral claim
  • Evaluating political rhetoric
  • Analyzing a scientific claim against its evidence
  • Preparing a structured debate

Strengths

  • Encourages intellectual rigor
  • Makes assumptions explicit
  • Separates claims from the evidence for them

Limitations

  • Takes preparation
  • A vague claim produces a confusing map
  • Does not assess the quality of evidence by itself

Best stage: Evidence evaluation and conclusion development.

Technique 07 · Chronology and Historical Development

Multi-Lane Timelines

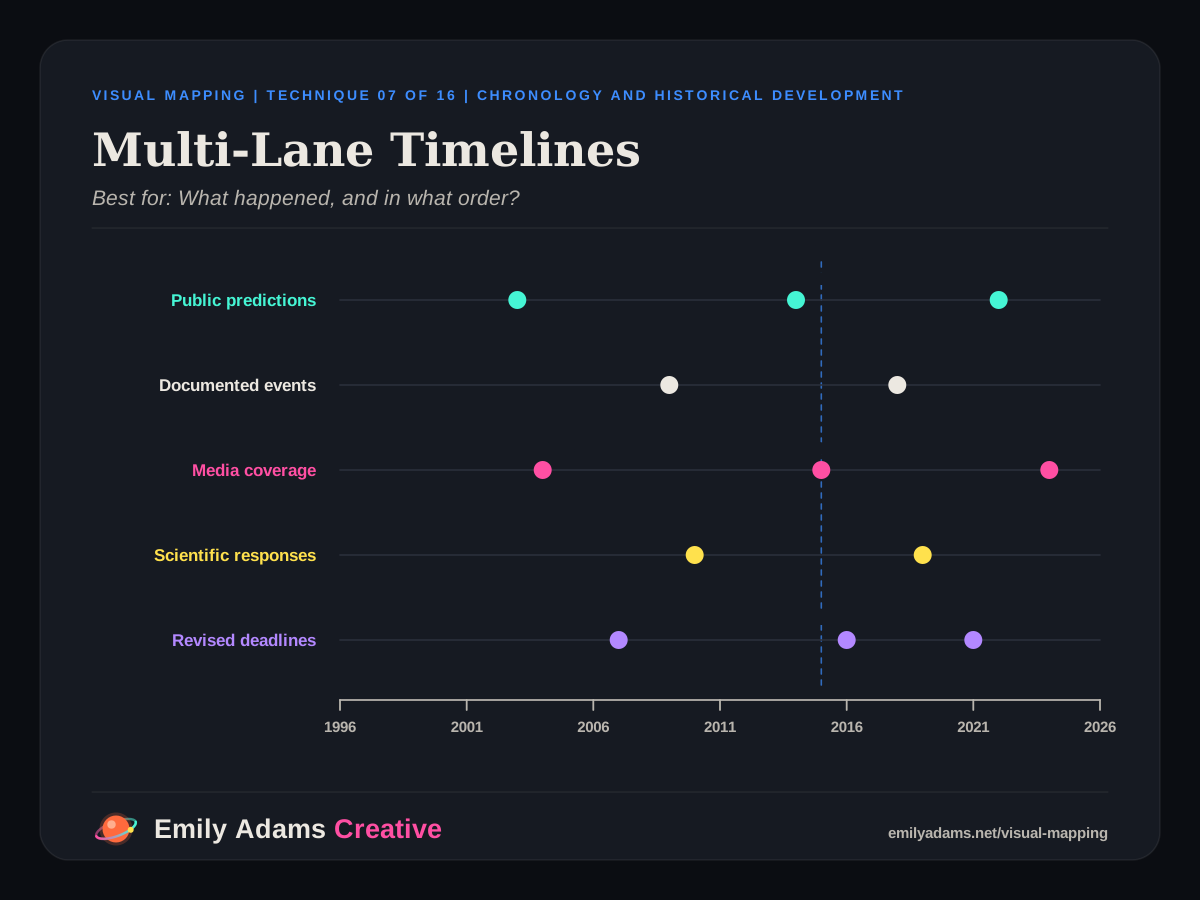
Best for: What happened, and in what order?

A multi-lane timeline places several parallel sequences on one shared time axis. Each lane tracks a different kind of development, so events that happen at the same time are visible together.

Practical example

1996 to 2026, with lanes for religious predictions, secular catastrophe predictions, documented violence, media coverage, scientific responses, and revised deadlines. Events that line up vertically show sequence and coincidence without claiming a cause.

Good uses

  • Historical investigations
  • Tracking revised predictions or changing policy
  • Comparing parallel movements
  • Showing long-term social change

Strengths

  • Clear chronological order
  • Shows simultaneous developments
  • Works across long periods

Limitations

  • Timing does not establish causation
  • Dense periods need zooming
  • Every event needs a verified date and source

Best stage: Historical reconstruction and comparative chronology.

Technique 08 · Root Cause Analysis

Fishbone (Ishikawa) Diagrams

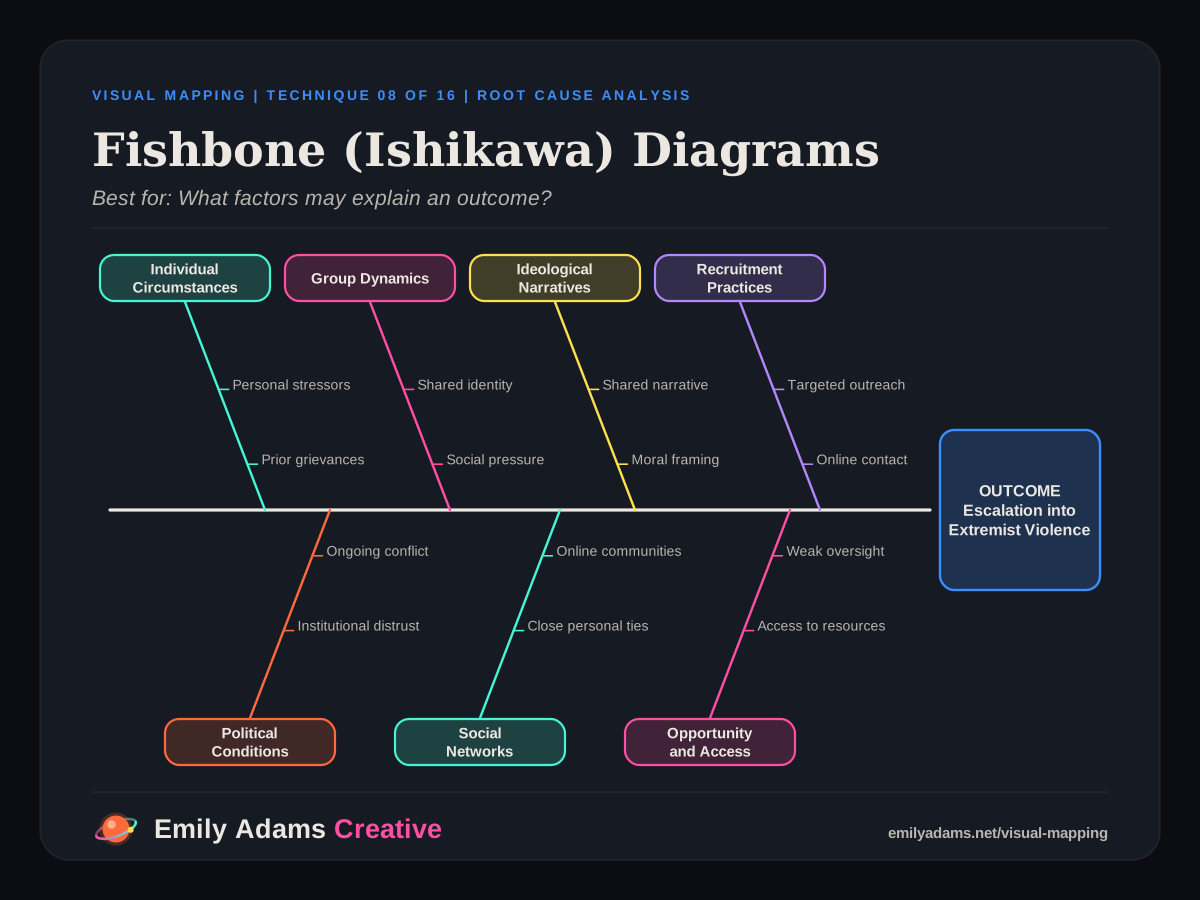
Best for: What factors may explain an outcome?

A fishbone diagram places an outcome at the head and sorts possible contributing factors into categories along the bones. It keeps an investigation from fixing on one cause too early.

Practical example

Outcome: escalation into extremist violence. Categories include individual circumstances, group dynamics, ideological narratives, recruitment practices, political conditions, social networks, and opportunity and access. The diagram lists what to investigate, and each factor must be tested before it counts as a cause.

Good uses

  • Investigating a complex outcome
  • Structuring a root cause analysis
  • Identifying contributing social factors
  • Generating research hypotheses

Strengths

  • Gives an investigation a systematic structure
  • Considers several explanations at once
  • Works well for group analysis

Limitations

  • Can suggest linear causation
  • Does not show feedback loops
  • Each proposed cause needs separate validation

Best stage: Developing and testing explanations.

Technique 09 · Comparison and Prioritization

Analytical Matrices

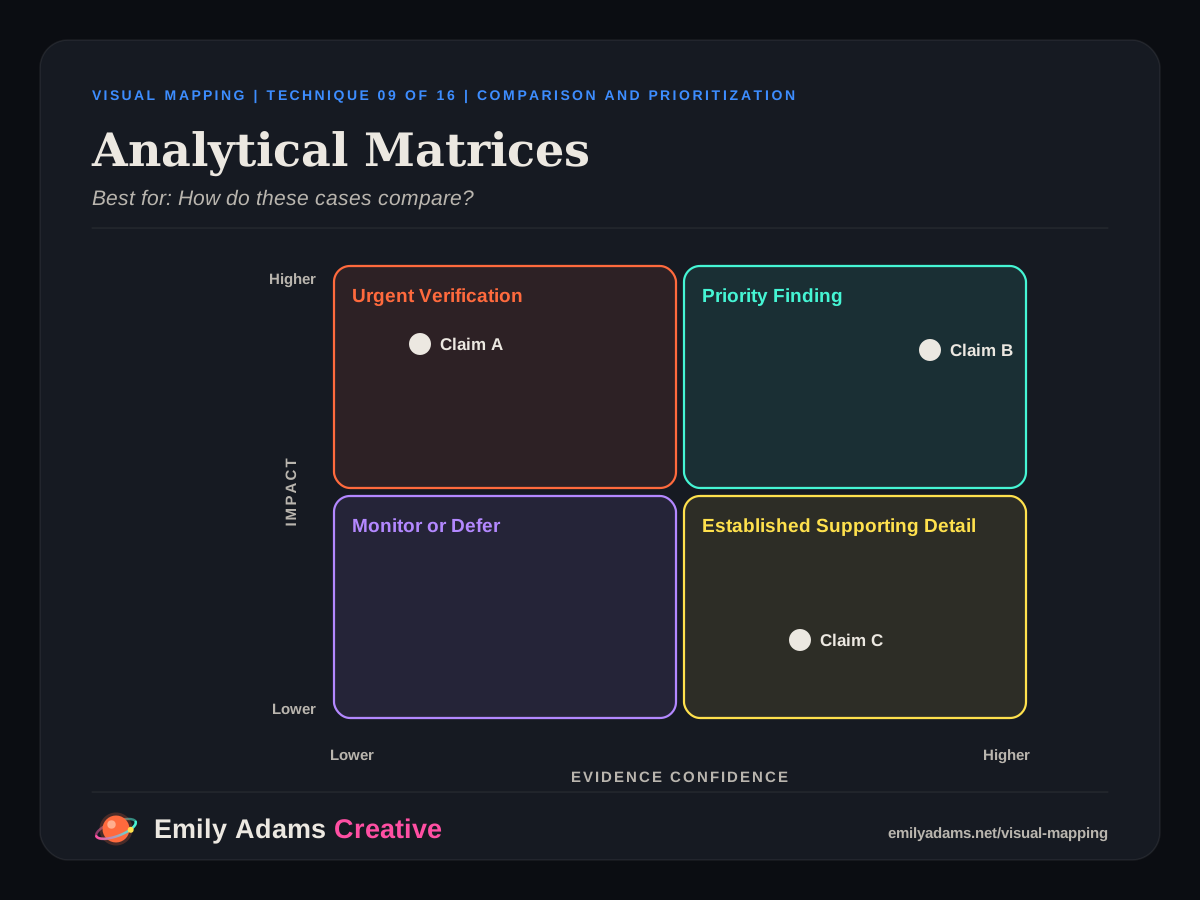
Best for: How do these cases compare?

A matrix arranges cases along two or more analytical dimensions, such as impact and evidence confidence. The grid makes the criteria explicit and shows where attention should go first.

Practical example

A claim evaluation matrix. Higher impact with lower confidence calls for urgent verification. Higher impact with higher confidence is a priority finding. Lower impact with lower confidence is for monitoring or deferral. Lower impact with higher confidence is established supporting detail.

Good uses

  • Comparing competing claims
  • Prioritizing investigations
  • Comparing institutions or movements
  • Setting a decision framework

Strengths

  • Easy to interpret
  • Supports decisions
  • Makes evaluation criteria visible

Limitations

  • Ratings can be subjective
  • Two dimensions can oversimplify a subject
  • Scoring rules must be written down

Best stage: Comparative analysis and prioritization.

Technique 10 · Layered Systems Analysis

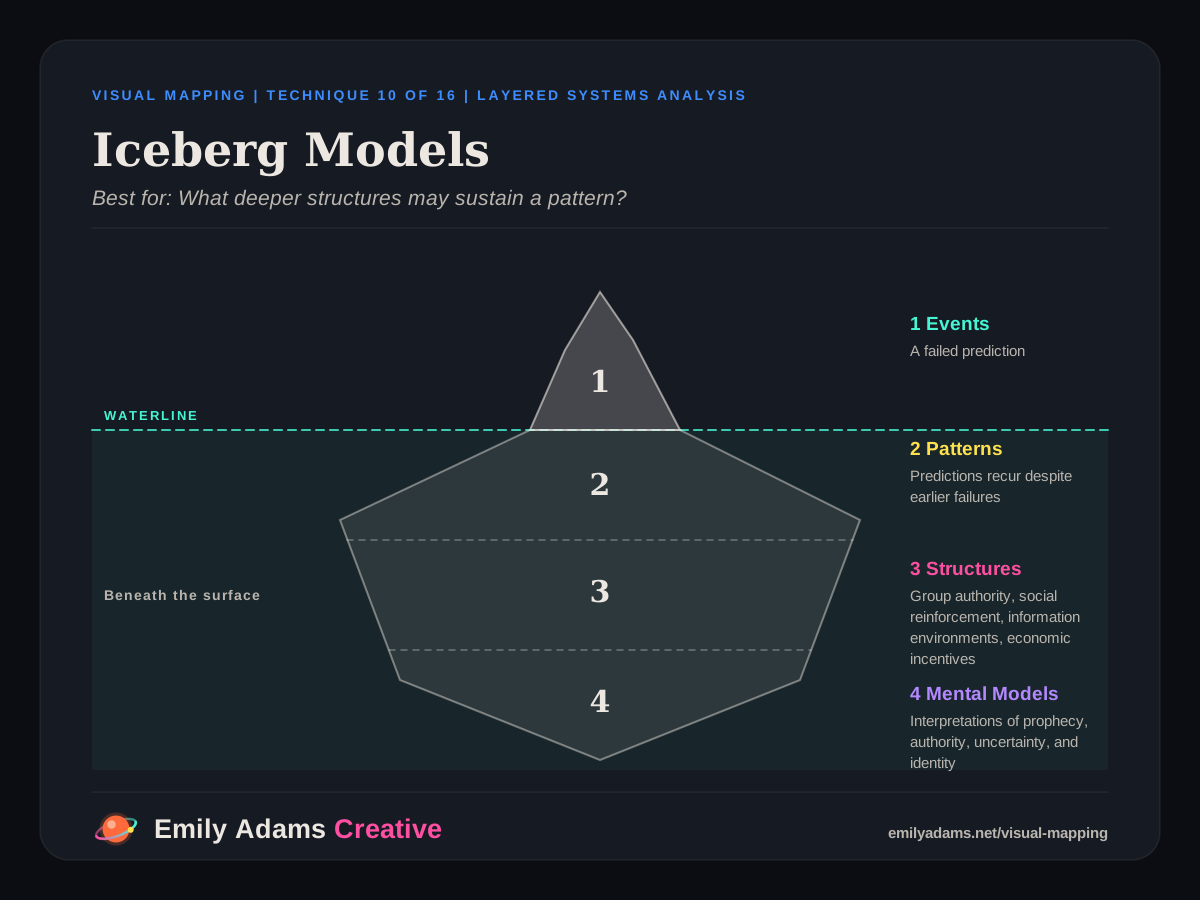
Iceberg Models

Best for: What deeper structures may sustain a pattern?

The iceberg model separates visible events from the patterns, structures, and mental models beneath them. It asks why a recurring event keeps appearing, not only what happened.

Practical example

Event: a failed prediction. Pattern: predictions recur despite earlier failures. Structure: group authority, social reinforcement, information environments, and economic incentives. Mental models: interpretations of prophecy, authority, uncertainty, and identity.

Good uses

  • Institutional and organizational analysis
  • Social psychology and cultural research
  • Understanding recurring social problems
  • Developing research questions at several levels

Strengths

  • Looks below the surface of events
  • Separates single events from recurring conditions
  • Suits systemic explanations

Limitations

  • Can imply hidden explanations without evidence
  • Underlying assumptions are hard to verify
  • Not every event reflects a stable recurring system

Best stage: Deep explanatory analysis.

Technique 11 · Logic and Conditional Reasoning

Decision Trees

Best for: Which action or classification follows?

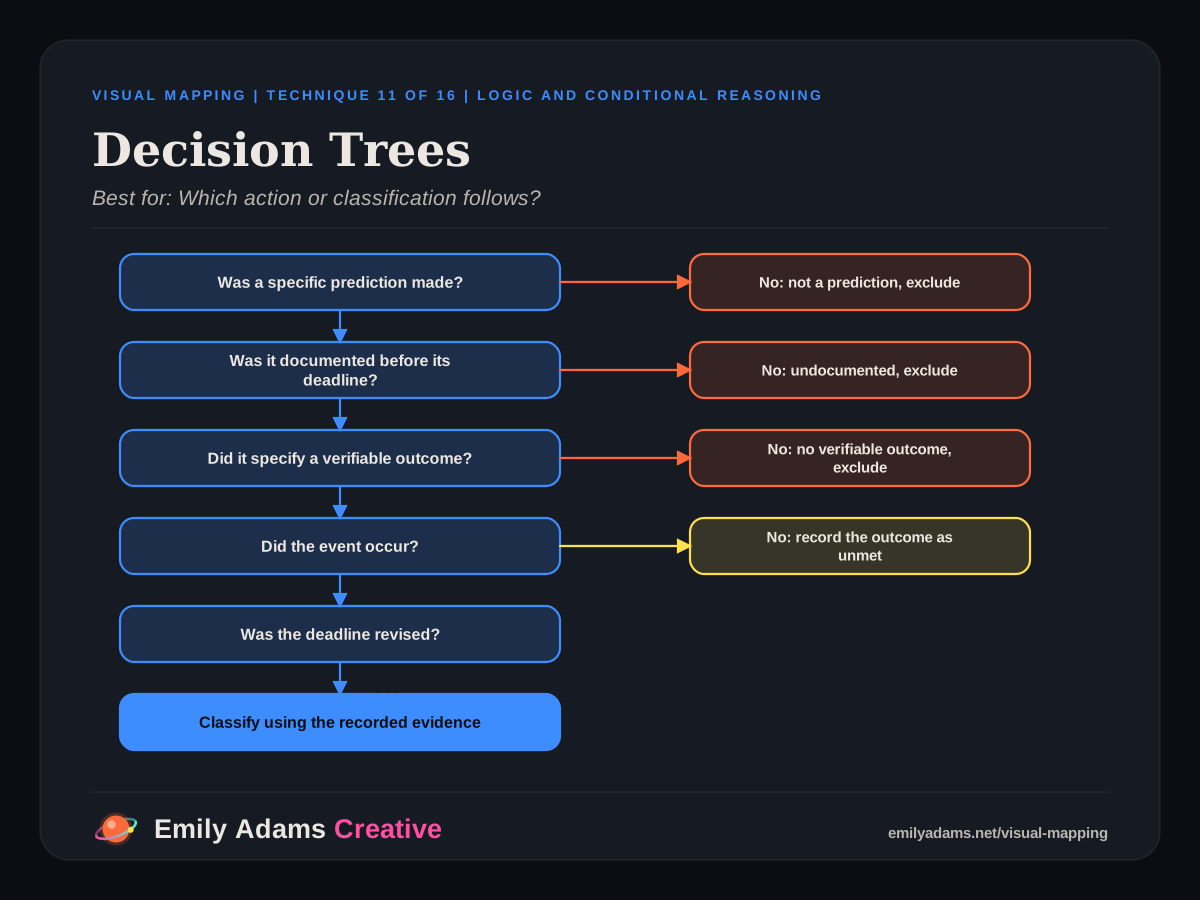
A decision tree turns a classification or evaluation into a sequence of explicit questions. Each answer sends the case down one branch, to the next question or to an outcome.

Practical example

Evaluating a prediction: Was a specific prediction made? Was it documented before its deadline? Did it specify a verifiable outcome? Did the event occur? Was the deadline revised? Which evidence supports the final classification?

Good uses

  • Building an evaluation protocol
  • Setting research decision rules
  • Creating a fact-checking workflow
  • Standardizing repeatable classifications

Strengths

  • Highly structured
  • Transparent decision logic
  • Easy to standardize and automate

Limitations

  • Complicated subjects need many branches
  • Rigid rules can exclude nuance
  • Poorly worded conditions produce misleading results

Best stage: Standardized analysis and repeatable workflows.

Technique 12 · Movement, Pathways, and Transitions

Sankey and Flow Diagrams

Best for: How do resources or information move?

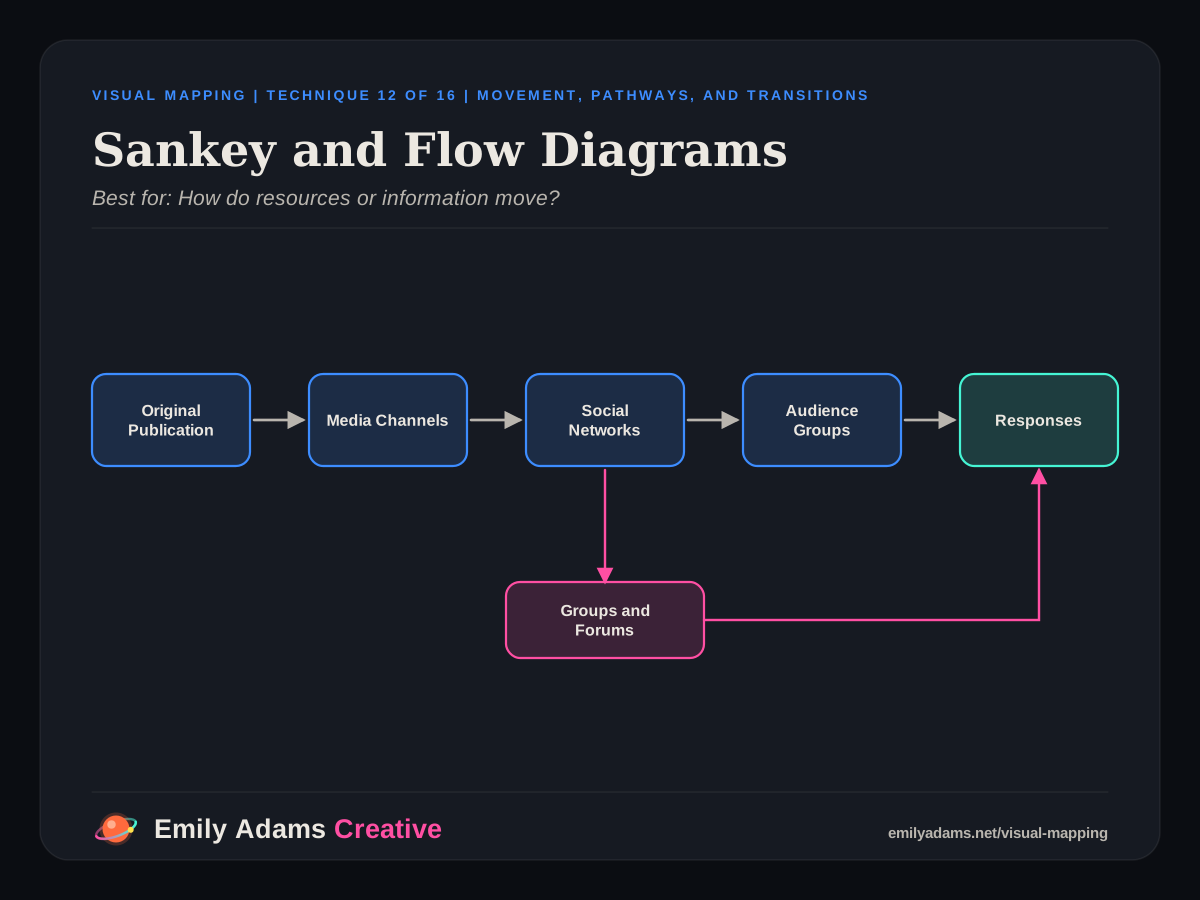
A flow diagram shows movement from one stage to the next. When verified quantities exist, a Sankey diagram gives each connection a width proportional to its volume, so the largest flows stand out.

Practical example

Original publication, then media channels, then social networks, then audience groups, then responses. Without verified numbers, the chain is drawn as an ordinary flow with arrows of equal weight.

Good uses

  • Mapping how information spreads
  • Studying organizational funding
  • Tracking institutional processes
  • Showing changes in participation between groups

Strengths

  • Communicates movement clearly
  • Reveals concentrations and bottlenecks
  • Easy to read at a glance

Limitations

  • Quantitative Sankey charts need consistent measurements
  • Can hide individual cases
  • A flow does not establish cause

Best stage: Process visualization and quantitative flow analysis.

Technique 13 · Similarity and Intersection

Venn and Overlap Diagrams

Best for: What characteristics overlap?

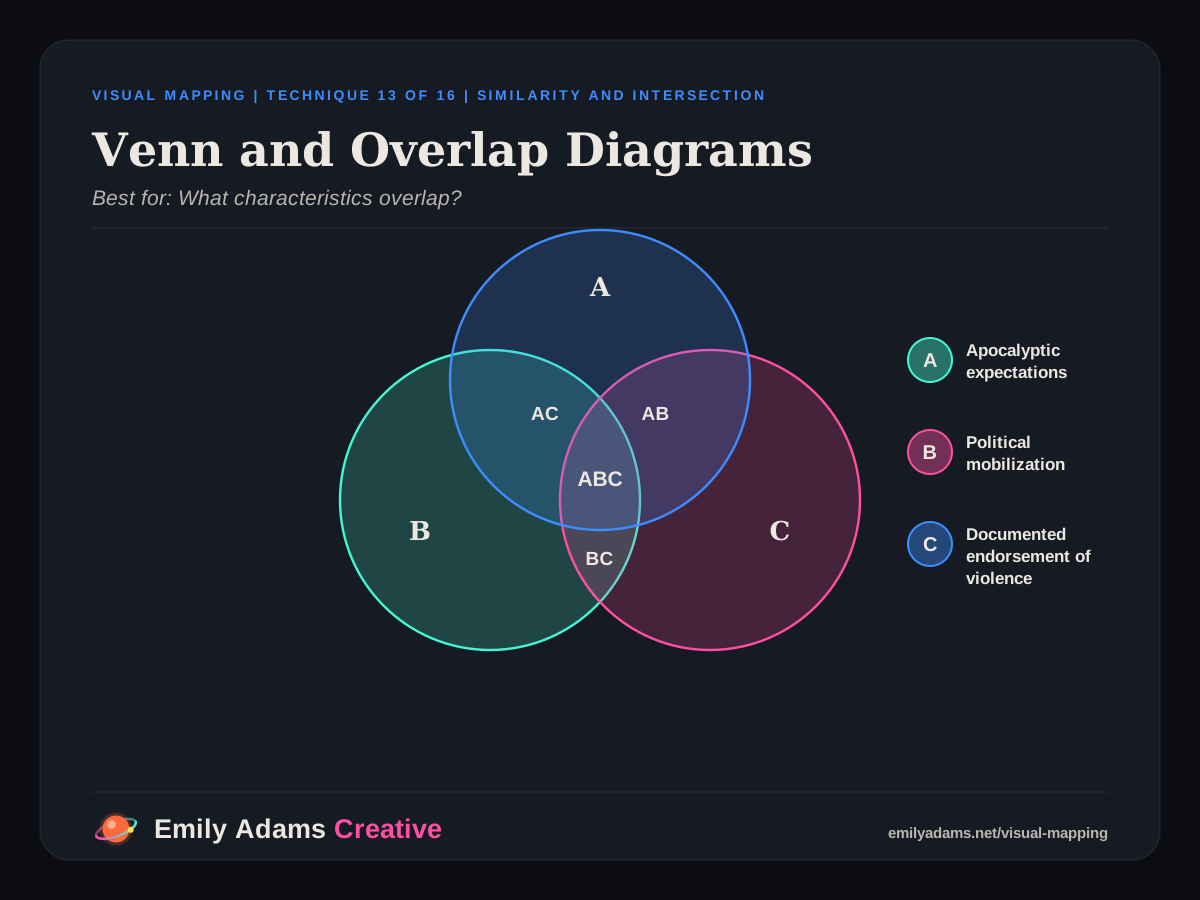
A Venn diagram shows which characteristics two or three groups share and which belong to one group alone. The overlap identifies the cases that meet several criteria at once.

Practical example

Three sets: apocalyptic expectations, political mobilization, and documented endorsement of violence. The center overlap marks movements that meet all three. Sharing a characteristic does not establish organizational ties.

Good uses

  • Comparing ideologies
  • Identifying traits that movements share
  • Clarifying overlapping definitions
  • Comparing philosophical frameworks

Strengths

  • Simple and accessible
  • Clear for showing conceptual overlap
  • Shows both similarities and differences

Limitations

  • Becomes cumbersome beyond three or four sets
  • Complex intersections are hard to read
  • Conceptual similarity is not the same as association

Best stage: Comparing a small number of concepts or classifications.

Technique 14 · Structured Ideation

Lotus Blossom Maps

Best for: How can a topic be expanded systematically?

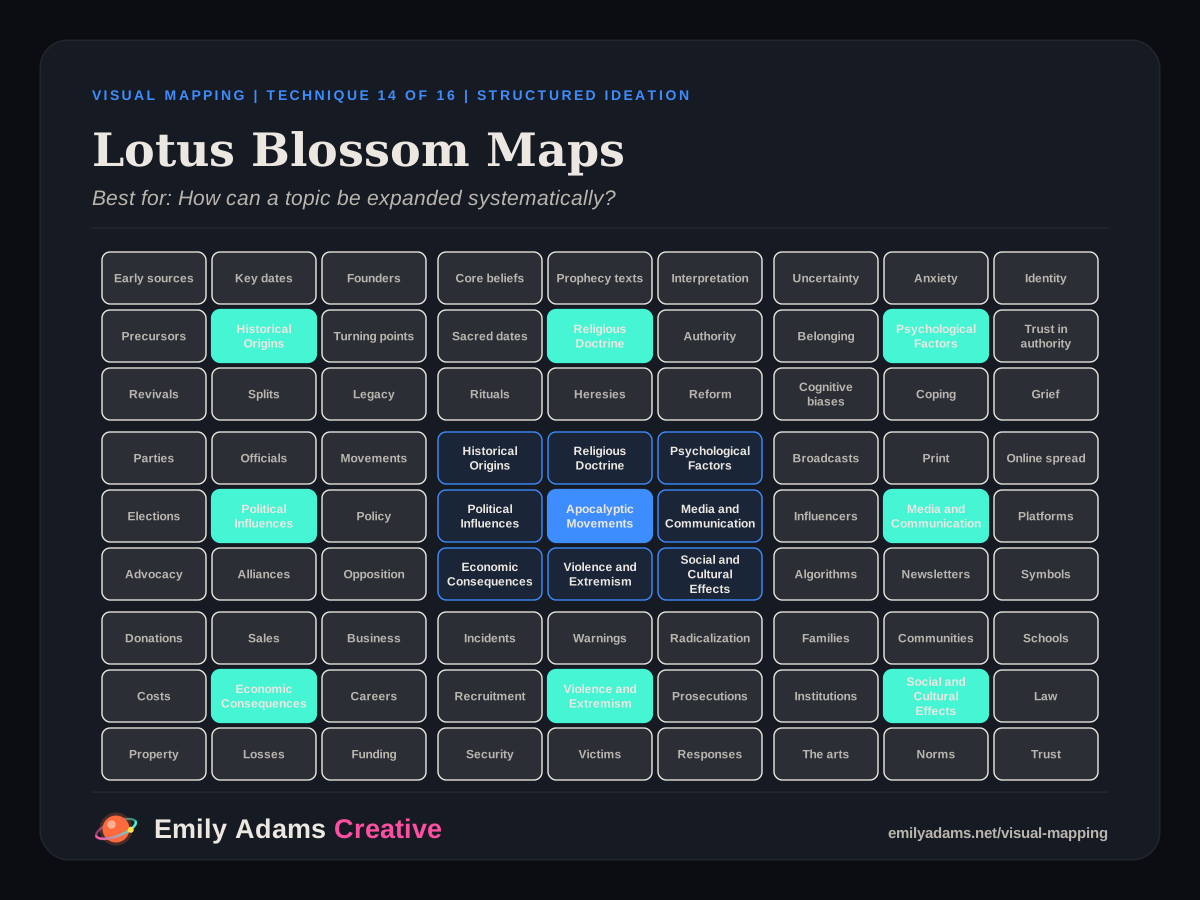
A lotus blossom starts with a central concept surrounded by eight major themes. Each theme then becomes the center of its own cluster of eight related questions, which gives a repeatable way to expand a research agenda.

Practical example

Central subject: apocalyptic movements. Eight themes: historical origins, religious doctrine, psychological factors, political influences, media and communication, economic consequences, violence and extremism, and social and cultural consequences. Each theme expands into eight questions.

Good uses

  • Building a comprehensive research agenda
  • Generating subtopics for a book or project
  • Finding perspectives that are being overlooked
  • Listing open questions

Strengths

  • Encourages systematic exploration
  • Prevents overemphasis on one dimension
  • Repeatable for early planning

Limitations

  • The eight-part format is somewhat arbitrary
  • Some subjects need fewer or more branches
  • Links between themes are hard to show

Best stage: Comprehensive topic discovery.

Technique 15 · Qualitative Analysis and Thematic Clustering

Affinity Diagrams

Best for: What recurring themes emerge from observations?

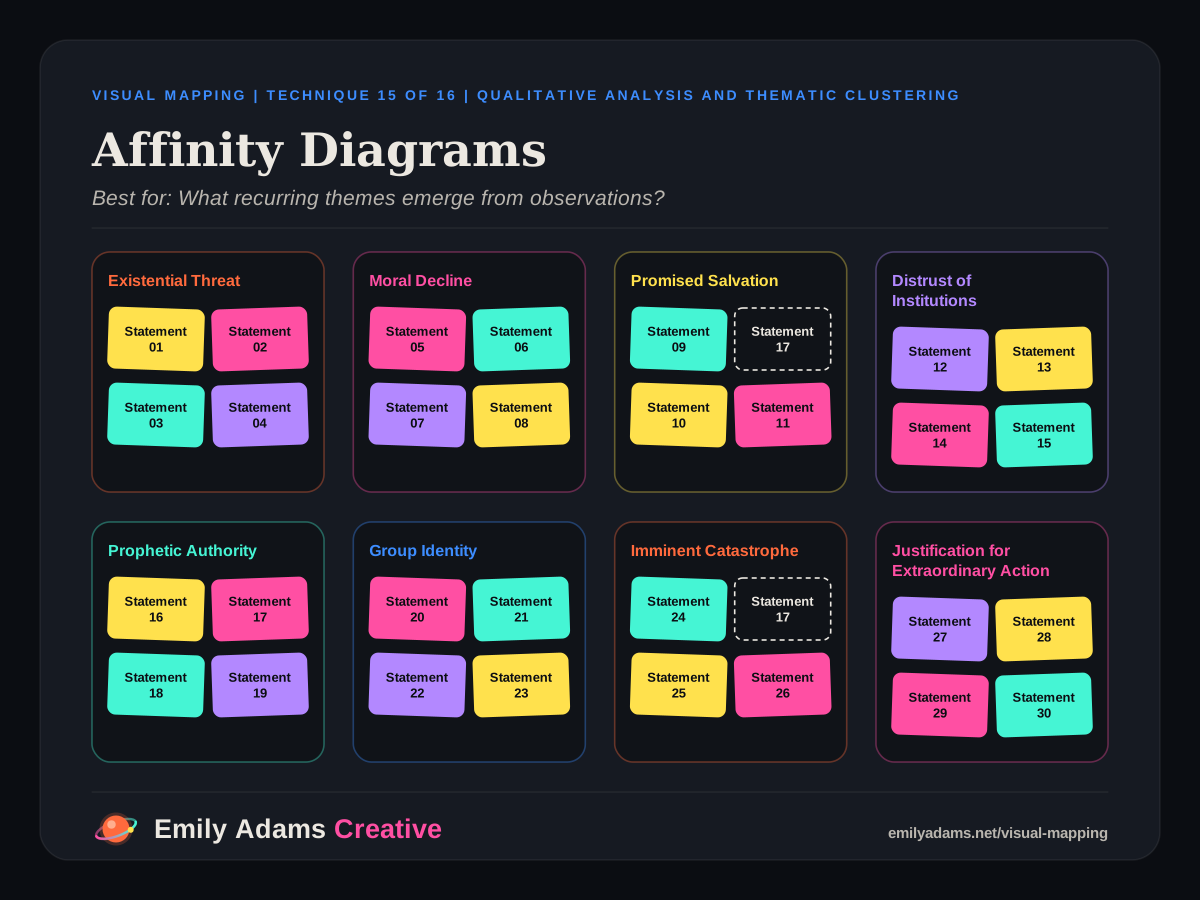
An affinity diagram groups a large set of observations, quotations, or findings by the similarities that emerge. Unlike a taxonomy, the groups are discovered after the material is gathered rather than imposed in advance.

Practical example

Hundreds of documented statements are grouped into themes such as existential threat, moral decline, promised salvation, distrust of institutions, prophetic authority, group identity, imminent catastrophe, and justification for extraordinary action. A single statement may belong to more than one group.

Good uses

  • Analyzing interviews
  • Organizing qualitative studies
  • Finding common narratives across movements
  • Discovering patterns nobody expected

Strengths

  • Supports inductive analysis
  • Reveals unexpected patterns
  • Organizes large volumes of material

Limitations

  • Grouping decisions are partly subjective
  • Requires consistent coding
  • Themes are not statistically representative unless the sample is

Best stage: Qualitative evidence synthesis.

Technique 16 · Institutional, Social, and Power Analysis

Stakeholder and Influence Maps

Best for: Who holds authority or influence?

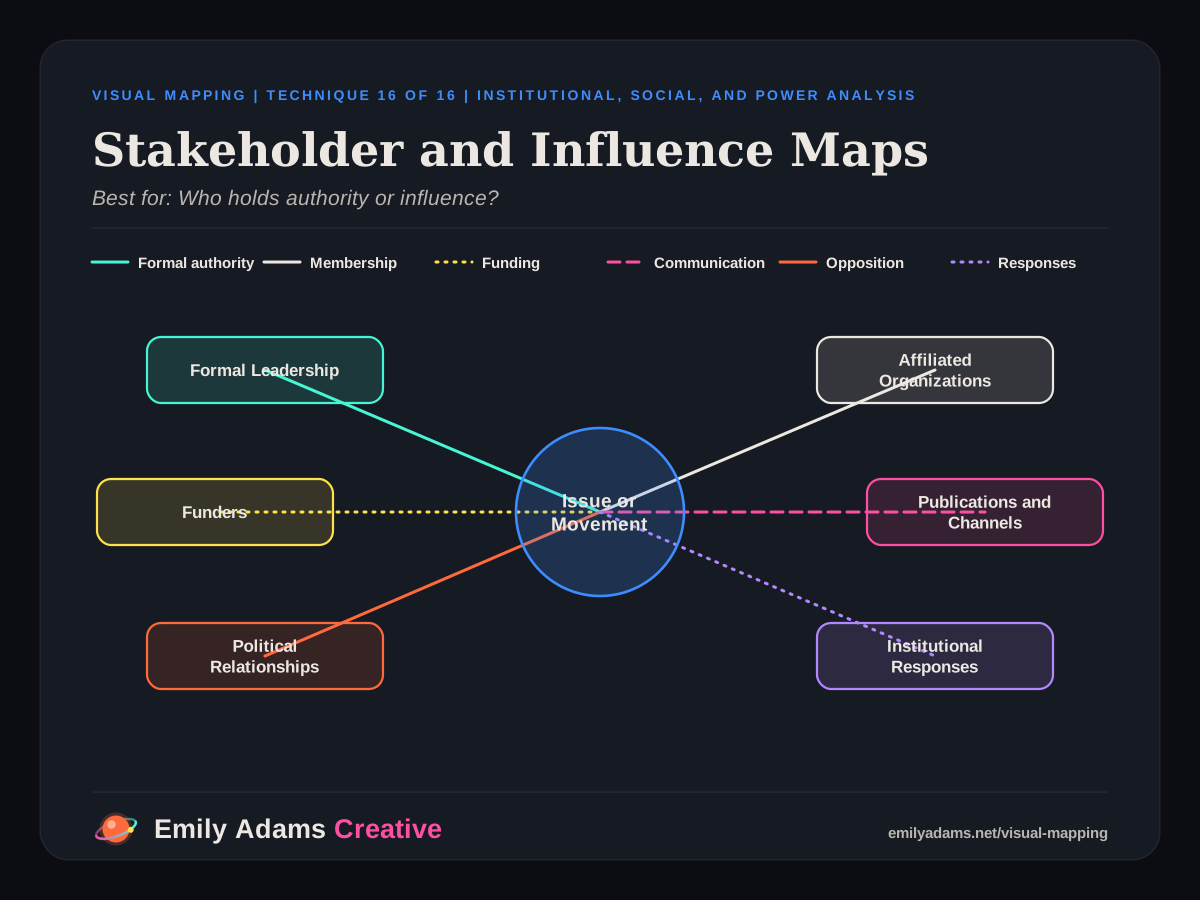
A stakeholder map shows the actors connected to an issue, organization, or movement and the kind of relationship each one has. An influence map focuses on authority, resources, communication, and the ability to affect outcomes.

Practical example

Formal leadership, affiliated organizations, funders, publications and communication channels, political relationships, and documented institutional responses. Each line is styled by relationship type, such as formal authority, funding, membership, communication, or opposition.

Good uses

  • Institutional power analysis
  • Studying political and advocacy organizations
  • Identifying decision-makers
  • Mapping resources and authority

Strengths

  • Shows organizational complexity
  • Separates formal authority from informal influence
  • Helps set research priorities

Limitations

  • Influence is difficult to measure
  • Public information may be incomplete
  • Association does not establish coordination, so each link needs documentation

Best stage: Institutional and organizational research.