The Case for Republican Stewardship
The claim is old and sincerely held. In its strongest form, it says that lower taxes, lighter regulation, and restraint on spending produce faster growth and more jobs, that growth in turn heals the budget, and that Republican presidents have delivered those results when Congress let them. Its defenders point to two stretches above all: the long recovery of the 1980s and the economy of 2018 and 2019, before the pandemic.
The case has serious advocates. The Tax Foundation projected that the 2017 tax law would raise long-run output by 1.7 percent and recover part of its cost through growth. Scholars at the American Enterprise Institute argue for extending that law in a form that does not add to the deficit. In 1996, two Cato Institute economists, one of them a former member of Reagan’s Council of Economic Advisers, wrote that the Reagan record beat the years before and after it on growth, income, inflation, and jobs. For decades much of the public agreed.
The claim can be tested, because the record is public. Output comes from the Bureau of Economic Analysis, jobs from the Bureau of Labor Statistics, deficits from the Office of Management and Budget and the Treasury, and the cost of laws from the Congressional Budget Office. The sections that follow run the claim against each of them, starting with the economy and ending with the budget.
Growth, Jobs, and Recessions by Party
“The economy always does better under Republicans.”
Commerce Department data show real GDP grew about 4.0 percent a year on average under Democratic presidents from 1949 to 2025 and about 2.6 percent under Republicans. Economists Alan Blinder and Mark Watson found the same gap, and that 41 of 49 recession quarters from 1949 to 2013 came under Republicans. They attribute much of it to luck, not policy.
Start with output. In the Commerce Department’s current figures, real GDP grew at an average annual rate of about 4.0 percent in quarters under Democratic presidents from 1949 to early 2025, and about 2.6 percent under Republicans. The economists Alan Blinder and Mark Watson found nearly the same split in the data through 2013: 4.35 percent against 2.54, a gap they called “astoundingly large.” The gap has narrowed with time. Counting only presidencies since 1981, it is about 3.0 percent against 2.6.
Jobs show a wider split. By the Bureau of Labor Statistics payroll count, the economy added about 50 million jobs under Democratic presidents from January 1989 to January 2025 and about 1.2 million under Republicans. That Republican total is dragged down by the 2001 and 2008 recessions and the 2020 pandemic, so the term-by-term numbers matter more than the sum. The first Trump term added 6.7 million jobs before the pandemic and ended with 2.8 million fewer than it began.
Recessions follow the same pattern. By the official dates, 10 of the 11 recessions that began from 1953 through 2020 started under Republican presidents. Unemployment and the stock market lean the same way: in Blinder and Watson’s data, unemployment fell during the average Democratic term and rose during the average Republican one.
What Presidents Do Not Control
None of this proves that Democratic policy causes faster growth, and the economists who measured the gap say so plainly. Blinder and Watson tested the obvious explanations. Congress was not it: growth tracked the party in the White House, not the party running Congress. Fiscal and monetary policy were not it either; if anything, they found policy a bit more stabilizing under Republicans. What explained slightly more than half the gap was what they called good luck: Democrats drew gentler oil shocks, faster productivity growth, stronger growth abroad, and perhaps more confident consumers. The rest, they wrote, “remains, for now, a mystery.”
Many of the biggest swings in the record trace to forces no president commands. The 1973 oil embargo nearly quadrupled the price of oil under Nixon. The Federal Reserve sets interest rates, and its chairs serve across administrations. Paul Volcker, appointed by Carter in 1979, drove interest rates to 20 percent to break inflation, which hurt Carter and helped cause the deep 1981 to 1982 recession that preceded the recovery Reagan is credited with. The 2020 pandemic produced the steepest job loss on record under Trump and much of the rebound under Biden. And under the Constitution, Congress writes the budget, not the president.
That caution cuts both ways. A Democrat who claims credit for a stock rally or a jobs report is claiming credit for luck too. The honest reading is narrower than either party’s slogan: the record gives no support to the claim that the economy does better under Republicans, and most of the evidence runs the other way, for reasons that are only partly about policy.
Deficits and Debt by President
“Republicans are the party of balanced budgets.”
The last federal surpluses came in fiscal 1998 to 2001, under Clinton. Under Reagan, debt held by the public rose from 25 to 39 percent of GDP. A budget watchdog found Trump’s first-term laws added $8.4 trillion to ten-year borrowing, and the Congressional Budget Office scored his 2025 law at $3.4 trillion more before interest.
The fiscal claim is easier to test, because deficits are counted to the dollar. Measured as a share of the economy and counting each president from his first full fiscal year, deficits averaged about 4.1 percent of GDP under Reagan, 4.1 under George H. W. Bush, 0.1 under Clinton, 3.3 under George W. Bush, 4.9 under Obama, 8.7 under Trump’s first term (4.2 before the pandemic), and 5.8 under Biden. The only surpluses in more than half a century came in fiscal 1998 through 2001.
Debt tells the same story. Under Reagan, debt held by the public rose from 25 percent of GDP to 39 percent. It fell to 31 percent by 2001, then climbed again with the Bush tax cuts, two wars, and the 2008 financial crisis. The Committee for a Responsible Federal Budget totaled the laws each recent president signed and found $8.4 trillion in new ten-year borrowing under Trump’s first term and $4.3 trillion under Biden through mid 2024, much of it pandemic relief that both parties voted for. The 2025 tax and spending law adds $3.4 trillion over ten years before interest, by the Congressional Budget Office’s count.
Where that leaves the country: total federal debt passed $40.6 trillion in November 2026, and debt held by the public reached 100 percent of GDP at the end of fiscal 2026, higher than in any year since 1946. The federal government now spends more on interest than on national defense.
Do Tax Cuts Pay for Themselves
“Tax cuts pay for themselves.”
The evidence says no. When a University of Chicago panel asked leading economists in 2012 whether a federal income tax cut would raise revenue within five years, none agreed. Even the Tax Foundation scored the 2017 law as losing $448 billion after growth, and Kansas reversed its 2012 cuts after revenue fell short.
The idea has a respectable root. Arthur Laffer’s curve makes a true point: at a high enough rate, cutting a tax can raise revenue, because the tax stops choking off the activity it taxes. With a top income tax rate of 91 percent in the 1950s and 70 percent until 1981, the point had force. The question is whether it holds at today’s rates. When a University of Chicago panel asked leading economists of both parties in 2012 whether a federal income tax cut would bring in more revenue within five years, not one agreed.
Growth does recover part of the cost, and the careful estimates say how much. Dynamic scoring, which counts growth effects, typically finds a fraction of a tax cut paying for itself, not the whole. The Tax Foundation’s own score of the 2017 law still showed a $448 billion loss. A 2012 Congressional Research Service study of top tax rates since 1945 found their reductions had little association with saving, investment, or productivity growth. A study of 50 years of tax cuts for the rich in 18 wealthy countries found they raised the top 1 percent’s share of income and had no significant effect on growth or unemployment.
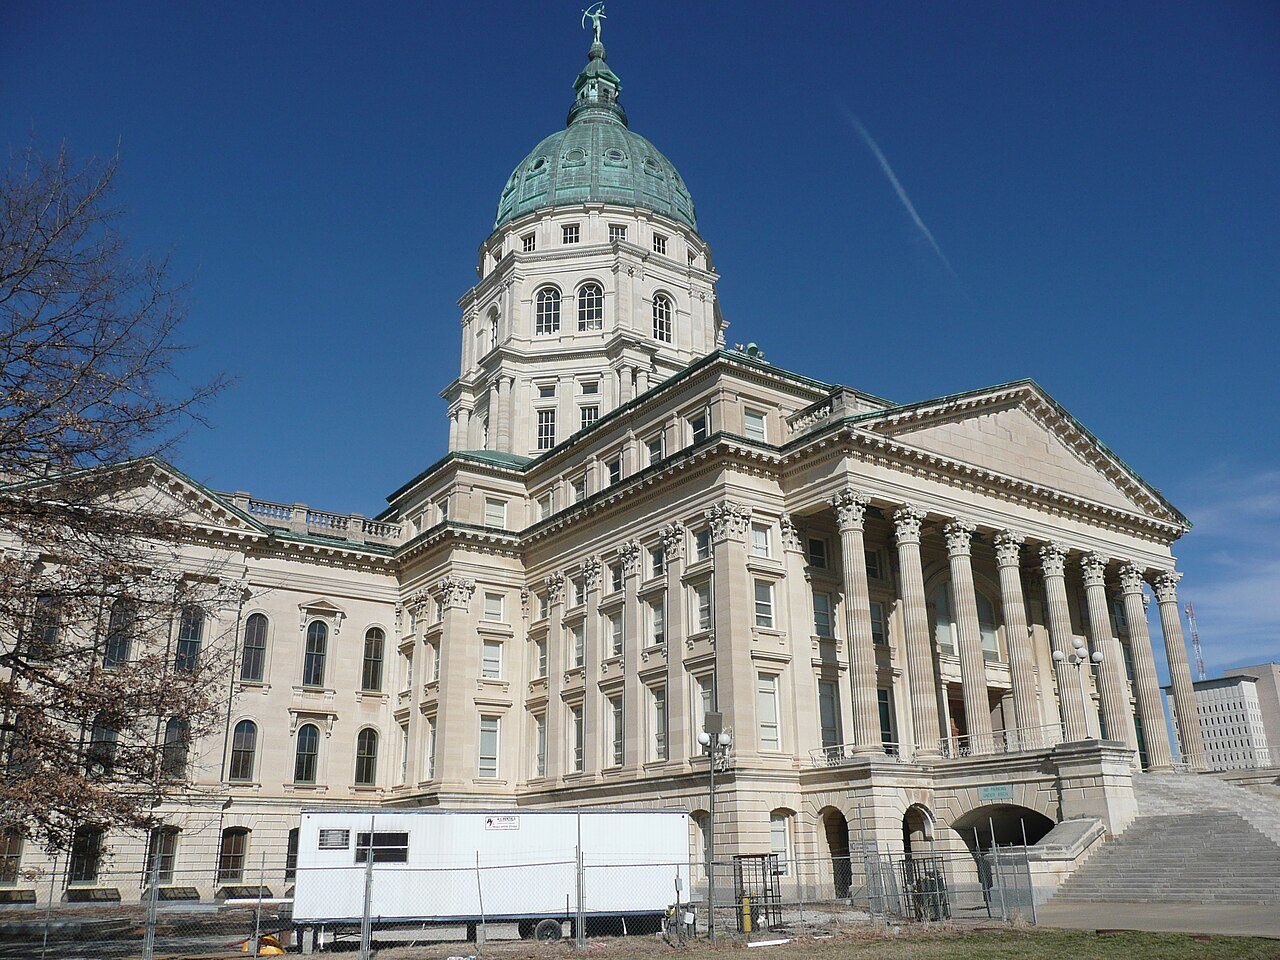
The cleanest American test ran in one state. In 2012, Kansas cut income taxes deeply, promising a surge of growth. The Kansas experiment produced budget gaps and slower growth than its neighbors, and a Republican legislature reversed it.
Starve the Beast and the Two Santa Clauses
If tax cuts do not pay for themselves, why keep cutting? Some conservatives said openly that the shortfall was the point. In 1976, the Wall Street Journal editorial writer Jude Wanniski urged Republicans to stop playing the scold and become “the Santa Claus of Tax Reduction,” leaving Democrats to own the spending. Two years later, Alan Greenspan told Congress that the basic purpose of a tax cut was to restrain spending by limiting revenue, the idea that came to be called starve the beast. Reagan put it to the country in 1981: Washington could lecture children about extravagance, or cure it by “simply reducing their allowance.”
It did not work. Research by Christina and David Romer, and by Cato’s own chairman, found that tax cuts did not restrain spending and may have raised it. By 2002, Treasury Secretary Paul O’Neill later recounted, Vice President Dick Cheney told him that “Reagan proved that deficits don’t matter.”
Deficits came to matter again when the other party held the White House. Congress has raised or suspended the debt ceiling 78 times since 1960, 49 of them under Republican presidents, usually as routine. In 2011 it became a hostage standoff with a Democratic president, and the country lost its top credit rating at Standard and Poor’s. In 2025, with a Republican president, the third major rating agency downgraded the United States as Congress prepared the largest addition to the debt since the pandemic.
Tariffs, Wages, and Regulation
“Tariffs are paid by foreign countries.”
Tariffs are paid by U.S. importers, and research finds most of the cost lands on Americans. New York Fed economists estimated U.S. firms and consumers bore 94 percent of the 2025 tariffs through August. The Tax Foundation estimated they cost the average household $1,000 in 2025, and the Supreme Court struck down the largest set in 2026.
Specific promises can be checked one at a time. Start with tariffs, presented since 2025 as a tax on foreigners. A tariff is billed to the American company that imports the goods, and studies of the 2018 and 2025 tariffs found nearly all of the cost passed through to American buyers. Tariff revenue did climb, to $195 billion in fiscal 2025, but that covered less than a tenth of the deficit. In February 2026 the Supreme Court ruled that the emergency law used for most of them did not authorize tariffs at all.

On wages, the long-standing warning that a higher minimum wage destroys jobs has been tested in dozens of natural experiments since 1992. The best of them find small or no job losses from moderate increases, though the Congressional Budget Office still projects some losses from large ones. On regulation, conservative groups publish trillion-dollar estimates of its cost; the Congressional Research Service warns they should be read with a great deal of caution, because they count costs without benefits.
Red States and Blue States
“Blue states are failing, and everyone is fleeing them.”
Commerce Department data put Democratic-leaning New York, Massachusetts, Washington, and California near the top in output per person, and Massachusetts ranks fourth in income adjusted for local prices. Several pay far more in federal taxes than they get back, and their residents live longer. Moves to the South are real but slowed sharply in 2025.
Within the country the comparison runs both ways, and it deserves care, because states differ in history, industry, and who lives there. Start with output. By Commerce Department figures for 2025, output per person was highest in New York, Massachusetts, Washington, and California and lowest in Mississippi, Arkansas, West Virginia, and Alabama. Adjusting incomes for local prices narrows the gap: high costs eat much of the coastal advantage, and Wyoming and South Dakota rank near the top.
Federal money flows mostly from richer states to poorer ones. The Rockefeller Institute’s balance of payments study found that in 2022 Connecticut, Massachusetts, and New Jersey sent far more to Washington than they received, while Kentucky, Alaska, and New Mexico were among the largest net receivers, along with Virginia and Maryland, home to many federal workers. The sharpest contrasts are in life expectancy and poverty, where the Deep South trails much of the Northeast and West. Taxes cut against the stereotype too: by one detailed count, the most regressive state tax systems, which charge low-income families the most as a share of income, include Florida and Texas.
People do vote with their feet. Domestic migration has carried millions toward the South and Mountain West, drawn by housing costs and jobs. But the flow is not a verdict on a party: Florida’s net gain from other states fell from 310,892 in 2022 to 22,517 in 2025.
Source: National Center for Health Statistics, U.S. State Life Tables, 2022, as compiled by KFF.
The Perception Gap
If the record favors Democrats on growth and neither party on debt, the Republican reputation needs explaining. For most of the past 35 years, Gallup’s question on which party would better keep the country prosperous has swung back and forth. In 2023, Americans picked Republicans by 53 percent to 39, the party’s widest lead since 1991. By September 2026 the answer had flipped to 51 percent for Democrats and 37 for Republicans, the Democrats’ widest margin since 2007. The swings follow the mood about whoever holds power, more than the long record.
Some of the reputation rests on metaphors that sound like common sense. Politicians of both parties, and Republicans most often, compare the federal budget to a family’s budget and promise to run government like a business. Both comparisons carry a real truth about living within limits, and both mislead in ways that matter for judging the record.
Source: Gallup, annual Governance survey, September 2023 and September 2026.
How the National Debt Works
The debt is a stock of Treasury securities, and knowing who holds it clears up several myths. Of the $40.6 trillion total in November 2026, $7.8 trillion was owed to federal trust funds such as Social Security’s, and $32.8 trillion was held by the public. Of that, foreign investors held about $9.3 trillion, led by Japan and the United Kingdom, not China, and the Federal Reserve held about $4.6 trillion. Most of the rest is owned by Americans, through banks, pension funds, mutual funds, and savings bonds.

A government is not a household. It does not retire, it borrows in a currency it issues, and it can refinance maturing debt indefinitely. That does not make debt free. Interest costs passed $1 trillion in fiscal 2026, more than the defense budget, and every dollar of interest is a dollar not spent on anything else or returned in lower taxes. Both parties have added to that bill. The long-term driver is the aging of the population and the cost of health care, which brings the story to the programs both parties promise to protect.
Social Security, Medicare, and Inequality
Social Security’s retirement fund and Medicare’s hospital fund are each about six years from running dry. The 2026 trustees’ reports project the retirement fund will be depleted in 2032 and the hospital fund in 2033, after which benefits would be cut automatically, by 22 percent for retirees, unless Congress acts. The last time the retirement program faced exhaustion, in 1983, a Republican president and a Democratic House fixed it together with tax increases and benefit changes.
The other long trend is who gets the gains. Since 1980, the share of income and wealth at the top has climbed steadily under presidents of both parties. Tax policy has pushed in one direction: the cross-country study of tax cuts for the rich found they raised the top share, and Yale’s Budget Lab estimated the 2025 law combined with tariffs would leave the poorest tenth of households worse off and the richest better off.
Where Economists Disagree With Both Parties
Promises to find the money in waste make a fair final test. In 2025, the Department of Government Efficiency promised to cut as much as $2 trillion a year. Its own running total claimed $175 billion by May 2025, a federal audit later found much of what it listed unsupported, and federal outlays rose from $7.0 trillion in fiscal 2025 to $7.4 trillion in fiscal 2026.
Neither party owns economic sense. Economists across the spectrum reject rent control, a policy popular among Democrats, almost as firmly as they reject broad tariffs. They criticize the mortgage interest deduction, which both parties have kept, because most of its benefit goes to high earners and it does little for homeownership.
What the record supports is this. The economy has grown faster, added more jobs, and spent less time in recession under Democratic presidents since World War II, largely for reasons of luck that no president controls. Deficits have run higher under recent Republican presidents than their reputation suggests, and the last surpluses came under a Democrat. Tax cuts have not paid for themselves anywhere they were tested. And the national debt is a bipartisan creation that neither party has shown much will to stop growing.